Every manufacturing business that intends to maximize profits should look to continuous improvement for help. The goal of continuous improvement is simple: improving processes within the company wherever possible at all times, quite simply, continuously improving in every area possible. The catch is that the areas for improvement and flaws within company’s operation may not be immediately evident to the average employee at a company. A specialist is often needed to implement continuous improvement, and this is where Continuous Improvement practitioners come in.
Continuous Improvement Practitioners are improvement experts, employing lean six sigma practices to make companies more efficient in all areas. They analyze manufacturing, management and communication processes as well as manufacturing data to identify inefficiency, waste and roadblocks to productivity. Then they form a plan of action with which the company will eliminate these problems. Practitioners often assemble and train teams of employees to tackle projects to improve processes and reduce waste, with the intention of empowering the employees to identify and fix these problems on their own.
Without the proper manufacturing data, however, Continuous Improvement Practitioners wouldn’t be capable of identifying problems within the manufacturing processes. Worximity has a solution, in the form of the Smart Factory Analytics Dashboard. The dashboard relays real-time factory production data on a Tileboard that is fully customizable based on the employee using it.
In this article, we review a Tileboard that’s been setup for the Continuous Improvement Practitioner.
Below is a Worximity Tileboard dashboard setup for Continuous Improvement:
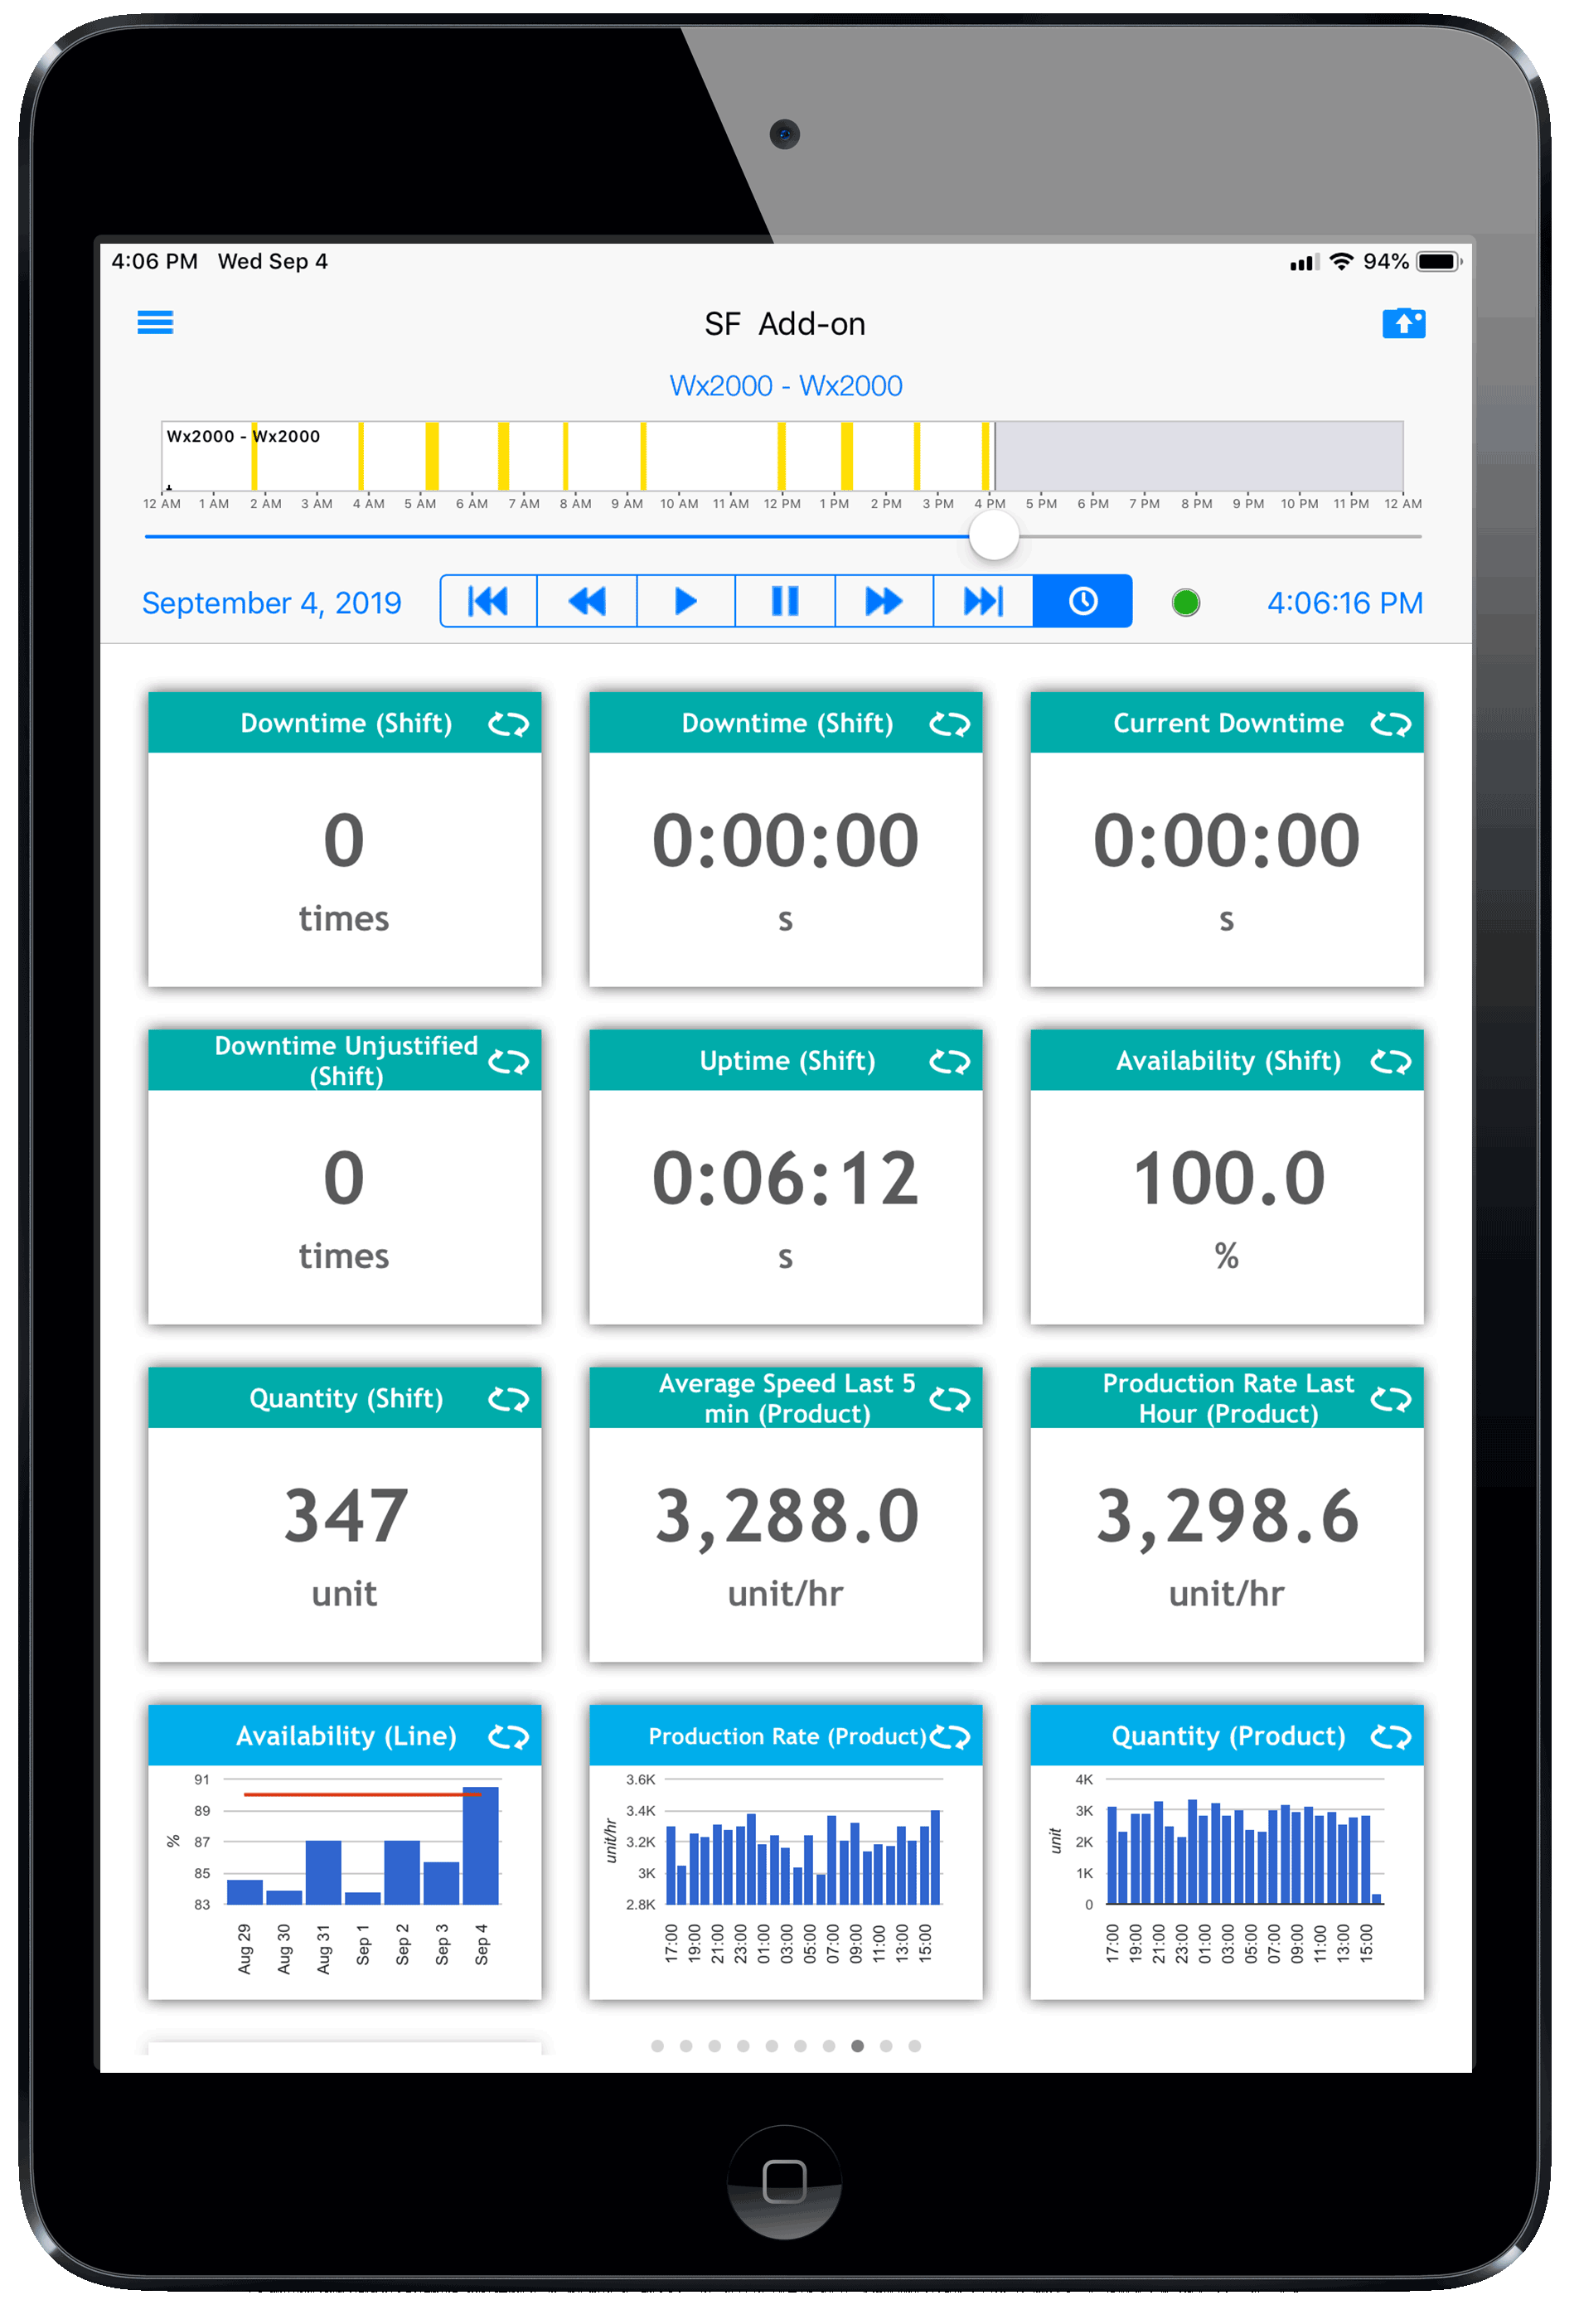
Example of a Continuous Improvement Dashboard
This dashboard reports in real time on the following critical parameters.
Production Control
While it would not necessarily be common for a Continuous Improvement Practitioner to control production, it is good to give them access to such control in case they need to make small adjustments to increase productivity and decrease downtime.
Downtime Unjustified (Shift)
The “Unjustified” or unplanned downtime tile displays how many unplanned downtime events have occurred in the current shift. This is a very important metric for a continuous improvement practitioner, as it can serve as a numerical representation for how efficiently a factory is operating and how productive they are during shifts.
Downtime (Product)
The “Downtime (Product)” tile indicates the amount of planned downtime events that occur during a shift. These downtime events indicate a less severe issue than unplanned downtime metrics, however, there is often still ample room for improvement here when aiming to reduce downtime.
Current Downtime
The current downtime tile acts basically as a stopwatch when a downtime event occurs. It indicates the length in minutes and seconds of a current downtime event, and can be a valuable tool for Continuous Improvement Practitioners to measure reaction time to a downtime event. A slow reaction to an easily fixable downtime event can indicate significant room for improvement in downtime reduction.
Quantity (Shift)
Quantity (Shift) can be a metric for a Continuous Improvement Practitioner to pay attention to, as it displays how productive employees have been over a shift, showing how much product has been produced. Especially over several weeks or months of implementing lean six sigma practices, if the value of the quantity tile at the end of each shift is increasing, this is a very good indication of the success of a Continuous Improvement Practitioner’s improvement efforts.
Production Rate Last Hour (Product)
Production rate gives a similar indication of productivity to the Quantity tile, but it is an even better indication of live, real-time production, as it shows the current speed at which manufactured units are being produced Continuous Improvement Practitioners can use this to set realistic goals about production rate increase, and can use it as a live metric to indicate whether or not changes that they made are having a positive effect.
Availability(Shift)
The availability tile indicates equipment availability during the shift. It is another indicator of downtime, showing what level of capability a facility has been at over the duration of the shift. If the availability is well below 100%, it is likely an indicator that there has been excessive downtime that should be investigated and reduced.
Downtime Cause
Downtime cause is one of the most important tiles on the dashboard, organizing downtime events into categories of what caused them. This can highlight recurring problems that cause downtime events, and can make it very clear and easy for Continuous Improvement Practitioners and other employees to diagnose where a problem is and start planning a solution.
Quantity (Line)
The Quantity(Line) tile allows an employee or Continuous Improvement Practitioner to view the units produced by an individual production line at each hour for the past 24 hours. This can display interesting data as it will indicate at what time of day a line is the most and least productive. This can highlight which shift of employees may be working more efficiently and which shift may need improvement in their working methods.
With these tiles and the data that they present giving live feedback to a Continuous Improvement Practitioner, they can focus in on specific areas that need improvement and make adjustments to help the company operate more efficiently. With the data displayed by the dashboard and the analysis presented by the Continuous Improvement Practitioner, employees will do their jobs more efficiently and solve problems more quickly on their own, making the entire company more productive and profitable.
Interested in accelerating your Continuous Improvement Program? Here's an easy way to get started!