According to some estimates, food processors lose as much as 500 hours of downtime per year at a single plant. This is a significant number for any company. These costs can be avoided or reduced by careful analysis and planning using Worximity’s Smart Factory analytics TileBoard systems to interconnect processing lines and bottleneck equipment. Once bottlenecks have been identified and analyzed, most underlying root causes can be eliminated or reduced to capture significant savings. Best of all, this can be accomplished with minimum investment.
How Bottlenecks Occur
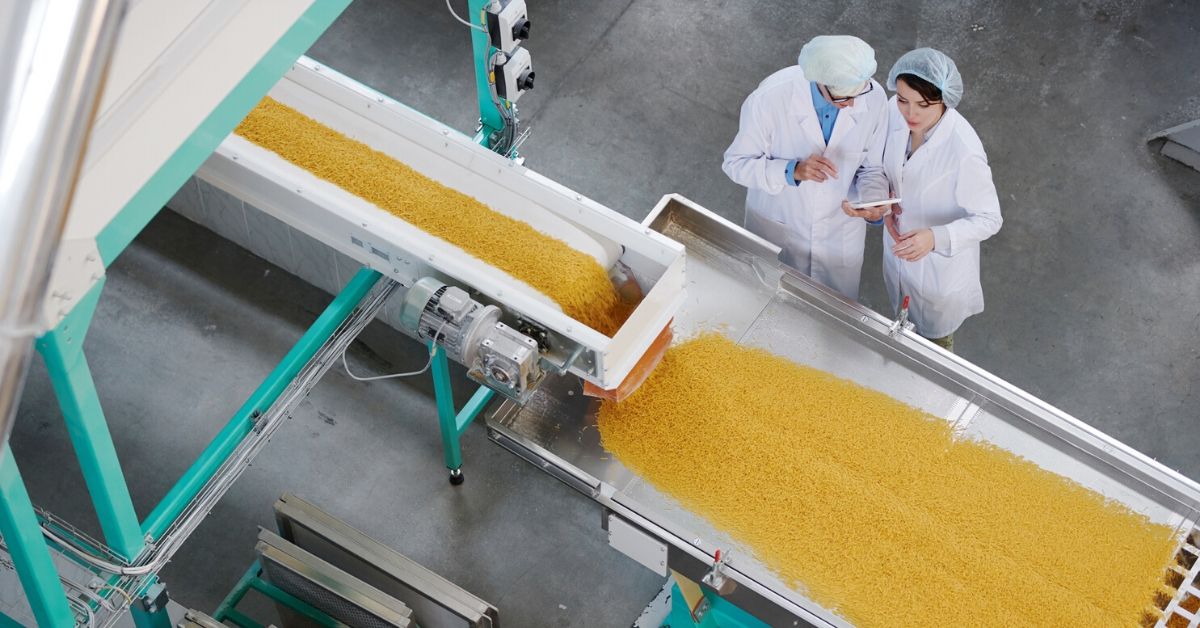
Any processing work step that is unbalanced compared to other process work steps may cause a bottleneck. In general, any constraint on total process throughput is defined as a bottleneck and represents an opportunity for increased throughput in manufacturing.
For example, if a filling machine runs at 500 parts per hour, but the bottle prep operation is feeding bottles to the filler at 600 bottles per hour, then a bottleneck will occur. Either the bottle prep operation must slow down, or empty bottles will accumulate in front of the filler. Typically, operators adjust the machine speeds to balance the flow. As a result, because the line runs smoothly, this type of bottleneck goes largely unnoticed—but it represents unused capacity, throughput, and lost profits. Nevertheless, appropriate equipment modifications may result in line balance to improve throughput in manufacturing.
Companies integrating their processing lines and equipment using Worximity’s Smart Factory analytics software have reaped excellent benefits from analyzing performance KPIs. For example, Voltigeurs Farm, a leading processor of poultry, realized a 64 percent decrease in length of downtimes, a 61 percent increase in factory availability, and a 43 percent increase in productivity. Acting on these savings and implementing improvements throughout, the company was able to increase production by 90,000 units per month. A significant portion of these savings was realized by eliminating major bottlenecks to improve throughput.
Connect Equipment to Identify Bottlenecks
A variety of bottleneck types may be present in business and manufacturing environments. Some of the most common reason for bottlenecks include:
- Line imbalances/equipment capacity differences
- Inadequate or incorrect planning, especially in supply chain forecasting
- Wrong settings on equipment feeds
- Inadequate staffing at work stations on the line
- Improper or out-of-date maintenance on equipment
- Equipment running slow or frequently stopping
- Imbalanced product mix
- Higher-than-expected yield losses
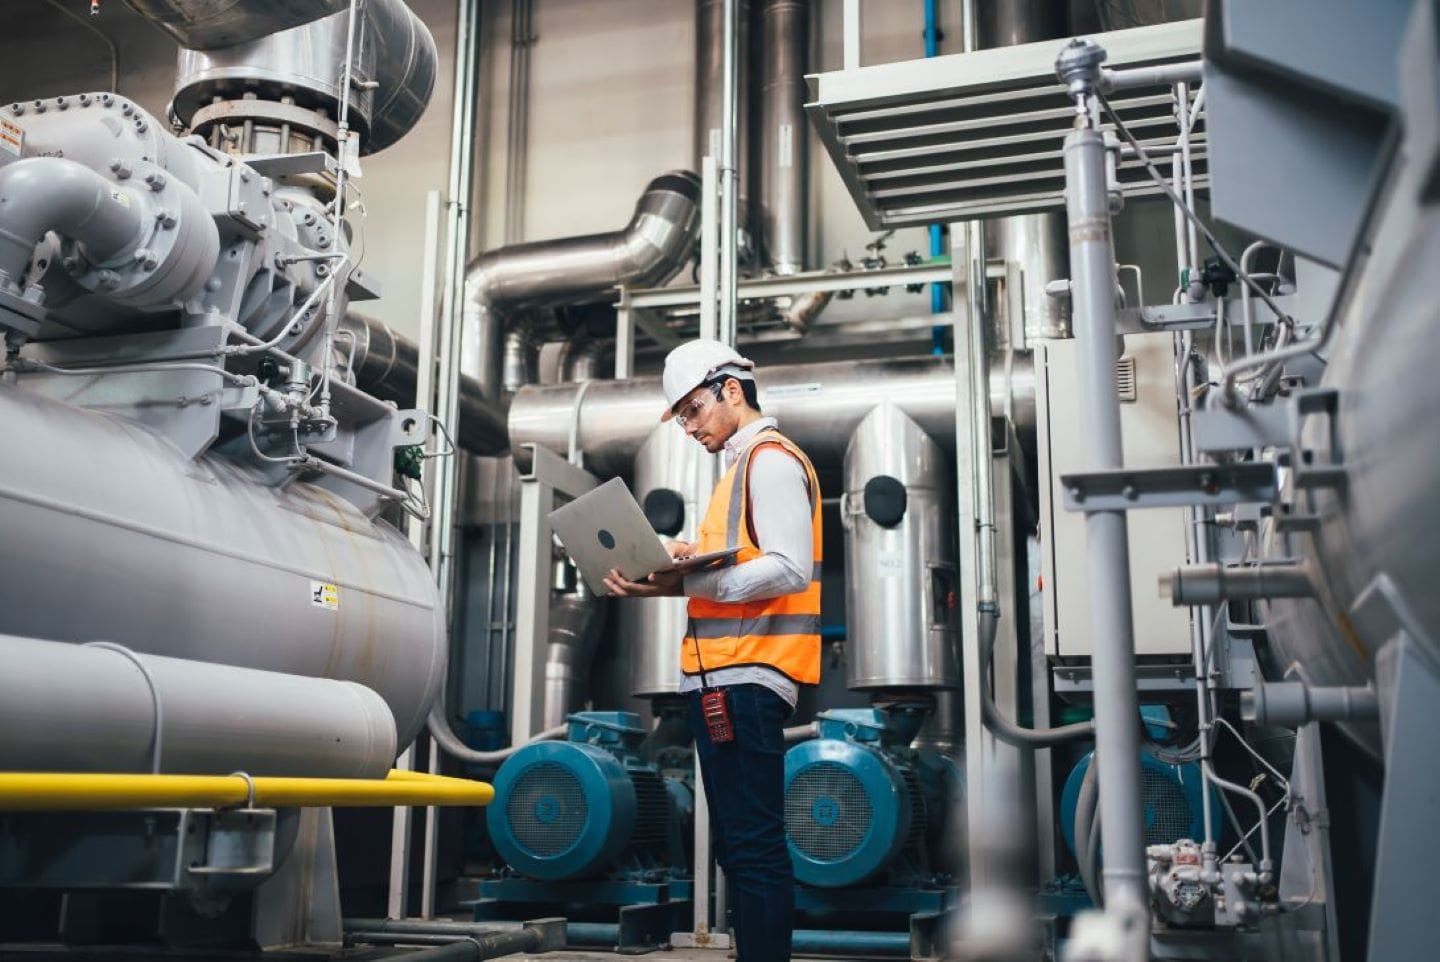
Any manufacturing company’s ability to identify, analyze, and eliminate bottlenecks effectively depends on having the right kind of data to improve throughput. Worximity’s Smart Factory analytics software provides that kind of data and analysis across the entire production floor. Using TileBoard monitors, managers can identify work steps in the process with throughputs falling below expectations. These are likely chokepoints and possible bottlenecks.
By monitoring product throughput by workstation, machine, line, or shift, manufacturers can identify patterns of throughput restrictions. Whether process constraints are hidden or apparent, it is important to compare operating speeds between process steps along the entire line. In this way, slow-downs or constraints can be analyzed and eliminated.
Investigate Line Performance Data to Eliminate Bottlenecks
Some of the most important KPIs used to identify and eliminate bottlenecks include:
- OEE for line and equipment
- Throughput
- Downtime and its causes
- Yields
- On-time deliveries
Use these metrics to identify those points along the processing line where production is constrained or equipment is running slower than ideal.
One of the most valuable pieces of information is performance, one of the components of overall equipment effectiveness (OEE). This value shows a process’s actual run speed as compared to its ideal run speed. If a bottleneck is constraining a machine, its performance will be lower than desired. This could mean its performance is being constrained by a bottleneck operation further along the process line. With this information, employees can identify the bottleneck and eliminate it through corrective action. In other cases, when different mixes of products are run simultaneously, the varying speeds required may create bottlenecks. Compare performance over several shifts to catch machine speed differences.
Worximity’s Smart Factory analytics software is a customizable smart software system that gathers production data in real time and uses it to generate important performance KPIs. Data is gathered using TileConnects (sensors) attached directly to equipment. This data is then sent to the cloud, where our Smart Factory analytics software calculates up-to-the-minute operating performance measures. These measures are then presented in real time on TileBoards (monitors) located throughout the factory. Employees and managers can continually monitor operations and take appropriate actions to improve throughput in manufacturing.
If you’re interested in turning your company into a Smart Factory, request a copy of our free Smart Factory Analytics Ebook. In it, you'll find a “roadmap” to becoming a Smart Factory, what it means to be a Smart Factory, and what ROI you can expect when you implement Smart Factory technology. Download your copy today or contact Worximity directly to discuss how we can help you on your journey.