OEE is a function of machinery performance, as measured by throughput, product quality, and machine downtime. Many manufacturers focus on quality ratio and throughput as primary metrics to improve their manufacturing operations as well as reducing downtime. Quality ratio is the ratio of good, non-defective products to the total products produced. It is an indicator of quality, showing how efficient and accurate a factory or line’s manufacturing process is. Manufacturing throughput is the ratio of units produced in a period of time.
Lean manufacturing, however, considers a broader range of measures beyond yield and throughput. These measures enable a production line to be optimized in ways that focusing solely on manufacturing yield and throughput don’t reveal.
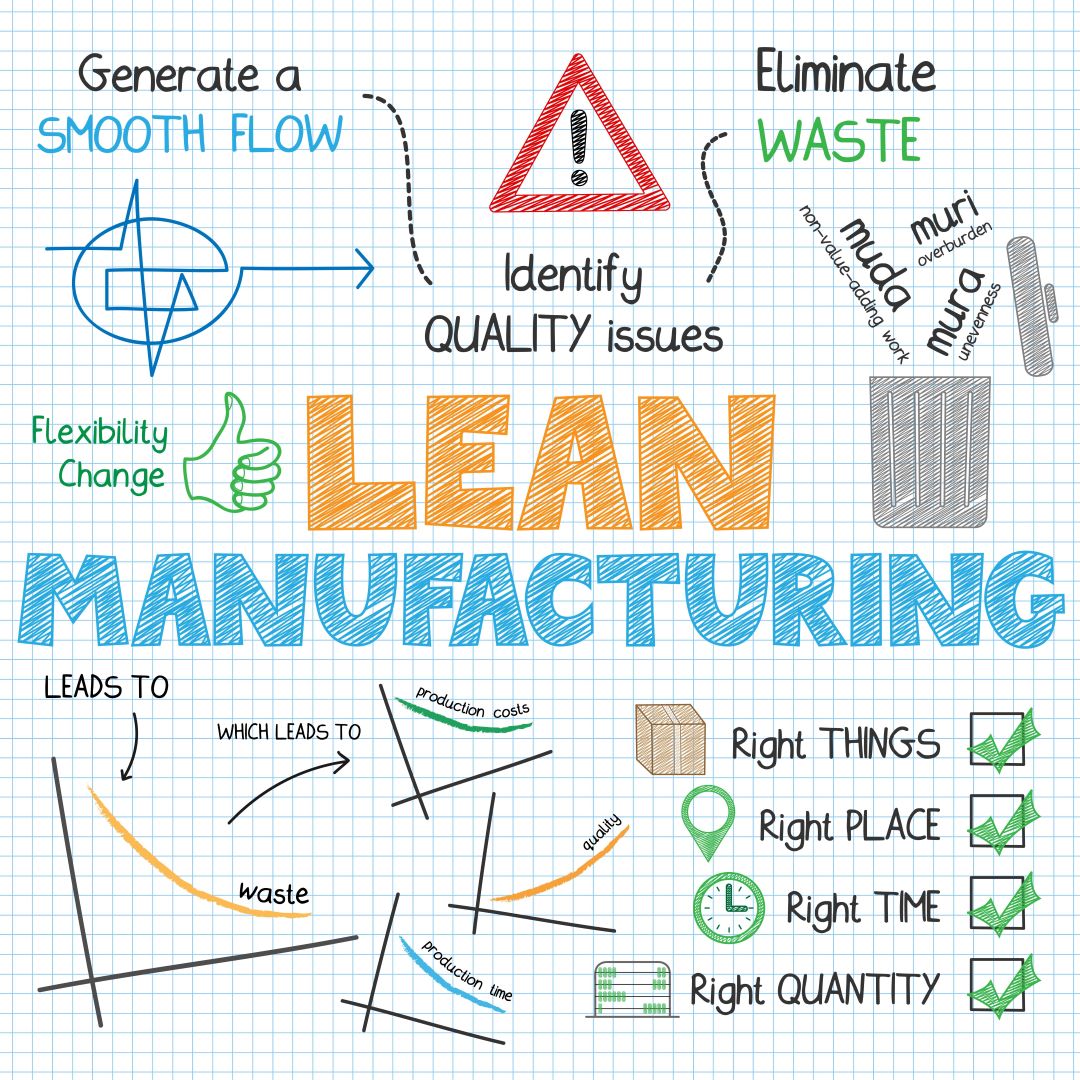
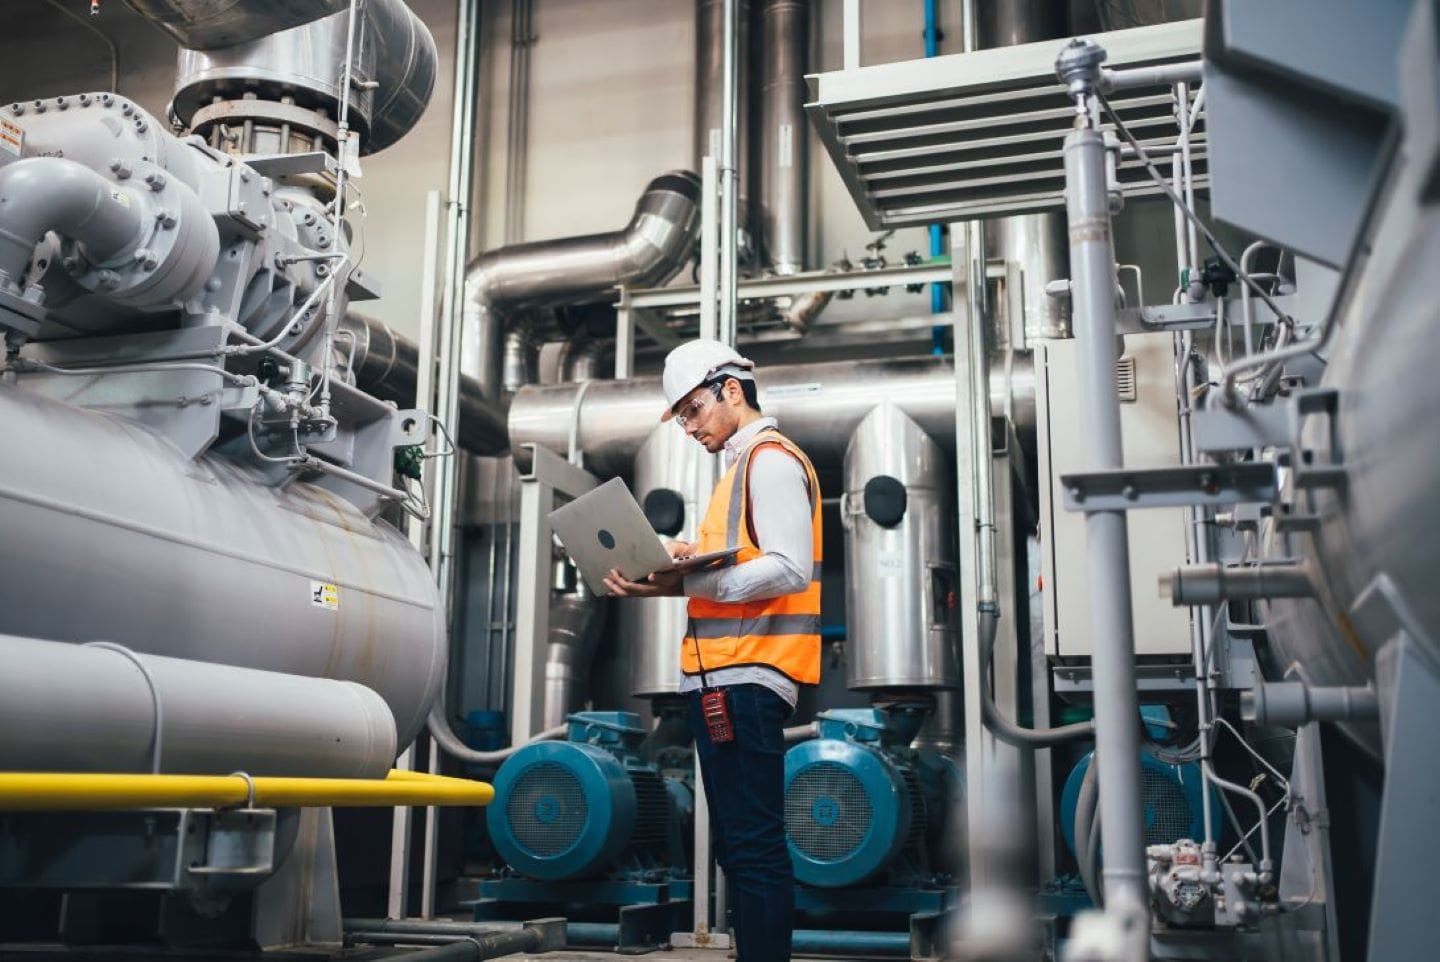
Lean Manufacturing Is a Method Used in the Manufacturing Industry That Is Intended to Reduce Waste and Increase Efficiency.
By using lean manufacturing methods, you can yield higher profits, safer work environments, and even happier customers.
Lean targets eliminating waste in eight areas, which can be remembered with the acronym DOWNTIME:
- Defects waste
- Overproduction waste
- Waiting waste
- Non-utilization waste
- Transport waste
- Inventory waste
- Motion waste
- Excess processing waste
We can start to discern the advantages of considering the lean manufacturing model instead of simply monitoring manufacturing yield and throughput by considering a simple hypothetical manufacturing line example.
In our hypothetical line, there’s a depalletizer, which transfers empty containers from a pallet onto a production line in preparation of them being filled. Next, there’s a filler that fills these containers and a labeler that applies labels. To keep the model simple, we’ve ignored other typical machines that might be in a line of this type.
Let’s say that each machine’s maximum throughput rates are as shown here:
Production Stage
Containers/Hour
Depalletizer
800
Filler
500
Labeler
1,000
A simple analysis tells you that the maximum throughput you’d be able to achieve with this line is 500 containers per hour, because the filler creates a bottleneck.
However, let’s make this model more accurate, and factor in the downtimes of each machine.
When evaluating downtime, there are two factors that are important. The first is the mean time between failure (MTBF), the average time that a machine runs before a failure occurs. The second is mean time to repair (MTTR), or how long it takes to get the machine back on line.
For the sake of this example, we’ll make some assumptions about our model. The depalletizer has longer and less frequent downtimes because these downtimes are predicated upon unloading a truck into the staging area. In our model, the depalletizer is otherwise a very reliable machine. The filler has more frequent and just as long downtimes because it periodically requires disassembly, cleaning, and reassembly. The labeler has frequent and short downtimes because it jams and needs to be cleared as well as periodically refilled.
Production Stage
MTBF
MTTR
Depalletizer
23 hours
1 hour
Filler
12 hours
1 hour
Labeler
4 hours
15 minutes
We can calculate the percentage of time each machine is running by taking the run time and dividing it by the total time, or run time/total time.
Production Stage
MTBF
MTTR
% of Time Running
Maximum Throughput
Actual Throughput
Depalletizer
23 hours
1 hour
23/24 = 95.8%
800
766
Filler
12 hours
1 hour
12/13 = 92.3%
500
461
Labeler
4 hours (needs refilling)
15 minutes
4/4.25 = 94.1%
1,000
941
We can now have a more realistic model that includes some downtime assumptions. In this model, the filler is still the bottleneck, and the maximum throughput that we think we’d achieve is 461 containers per hour because the throughput is still limited by the filler. This is assuming that our yield is 100 percent.
So maybe you’re thinking that under this model, things aren’t too bad! Our percentage of run time at each production stage is pretty high, in the low 90s.
Maybe we can tune things a bit and improve things at the margins. Or maybe we need to consider adding another filler in parallel to our existing machine or replacing the one we have outright with a higher production model and getting that part of the line up to the throughput of the rest of the line. Maybe we can even almost double our throughput!
Well, one problem with this analysis as it is shown is that each machine doesn’t go down at the same time. That would be too convenient!
In our model, because this is one line and each production stage is dependent upon the others, our actual percentage of running time is more likely a function of all of the running times together. So our line running time is more likely in the range of 95.8 percent x 92.3 percent x 94.1 percent, or about 83 percent. Now things are getting a bit interesting!
Using this percentage of running time, our actual throughput is probably running closer to 83 percent x 500, or 383 containers per hour. Adding a second filler or replacing the existing one would certainly improve things, but it would require a considerable investment. Are there other options?
Let’s Look at What Happens to This Analysis of Manufacturing Yield When We Consider Lean Manufacturing Principles.
Because each machine has mismatched throughput rates, we’re likely to immediately discern that we have some critical wastes happening.
Under the model above, while the filler is down, the depalletizer is idle, suffering from that downtime and creating waiting waste. It’s possible that we may have available space for buffer inventory from the depalletizer to accumulate pre-filled containers until the filler is back up and running.
We may want to keep the depalletizer running a bit while the filler is down, using that space to create a bit of buffer inventory. This enables our critical path machine, the filler, to be operating when the depalletizer is not. Of course the depalletizer’s actual throughput is quite high relative to our bottleneck, the filler. We don’t want to generate unnecessary overproduction waste.
An analysis of the depalletizer downtime patterns (if only we had this data at our fingertips!) will enable us to do a bit of planning. We can set the depalletizer production throughput goals at enough to create just the buffer we need for when the depalletizer is down, but not so much that we’re creating overproduction and, as a result, accumulating inventory waste that sits on our balance sheet and costs money.
More challenging is that while the filler is down, the labeler is waiting for containers and is unproductive, accumulating waiting waste as well. This waiting waste can be measured and tracked over time (with the right technology!).
If we can decouple the filler and labeler downtimes, we can increase the throughput of the entire system. This can be done by introducing a buffer, which is a way to expand the inventory produced by a machine in a production line conveyor system so that while it’s down, the next machine isn’t waiting for containers (thereby creating waiting waste).
A typical buffer can be created by simply extending the length of the conveyor system between two machines. In this case, we create a buffer to accumulate more filled containers between the filler and the labeler.
When we organize the system by measuring these types of waste, we can make sure that the filler and labeler both have containers to process while other stages of production are suffering downtime.
In this new production model, we’ve increased the throughput of the system. Instead of being constrained by the average downtime of the entire system, the system is now constrained only by the filler or labeler downtime. The filler is still the bottleneck, but now the system is constrained only by that stage of production and not the cumulative downtimes of each stage.
This means that throughput can be increased from 83 percent x 500 (the run time of the entire system times the maximum throughput of the filler) = 383 containers per hour to 92.3 percent x 500 (the run time of just the filler times the maximum throughput of the filler) = 461 containers per hour.
We gain an additional 78 containers per hour—without buying a new filler.
How Might Optimizing Manufacturing Yield in This Way Impact a Business?
In our make-believe model, let’s say that a container is worth $10. We’ve now increased revenue by $780/hour (461 - 383 = 78 containers per hour x $10 each).
For an operation that runs 24 hours x 365 days per year, this is an additional annual revenue of $6,832,000. You read that right. Those are compelling numbers that many manufacturing lines can achieve with little to no significant capital expenditures.
Implementing a system like Worximity helps you to quickly and cost-effectively measure key production factors such as manufacturing yield and downtime. A top-tier system also provides visibility into the types of lean wastes that are being generated, which can lead to quick and substantial ROI wins.
So not only can focusing on and reducing the eight types of waste in the lean manufacturing model can dramatically increase yield and throughput, but by tackling these wastes, you can also find additional latent capacity that you never realized that you had.
Implementing lean manufacturing principles can also do far more for a company. Lean manufacturing directly targets areas in which process efficiency can improve. When you identify these areas, you can increase production speeds and prevent both the employees and the machines from being overworked or over productive.
This will result in less wear on machines and fewer unexpected downtime events due to machine breakdown. Additionally, it has the potential to improve worker safety and morale. When improving the efficiency of a line, it is clear to workers what tasks are theirs, and it is easier for them to complete those tasks, leading to happier, healthier employees.
The model above assumes a relatively ideal world. There are a multitude of ways in which manufacturing yield can be improved because there are typically at least a few defective products and ways to prevent such defects from occurring in the future.
Line balancing is an important practice in manufacturing, and we’ve seen that it can generate substantial returns. But in industries such as food manufacturing, if one machine or line is producing material at a faster rate than the following machine or line can handle, the material has the potential to spoil as it is held up. This spoiled material can lead to additional wastes (counted as defects waste), which wouldn’t be reflected in a model like the one we outlined above.
If you’re like most of the companies that we work with, you’ll find that hidden capacity exists right in your facility that can be freed through having the right data at your fingertips to make good optimization decisions. This capacity can often be revealed without significant capital investments.
Worximity’s e-book, Leveraging Technology to Calculate OEE in Manufacturing, is your step-by-step guide to implementing a Smart Factory analytics solution. Reach your goal of easily measuring OEE at the machine, production line, and facility level, and get your company competitive with the best in your industry!