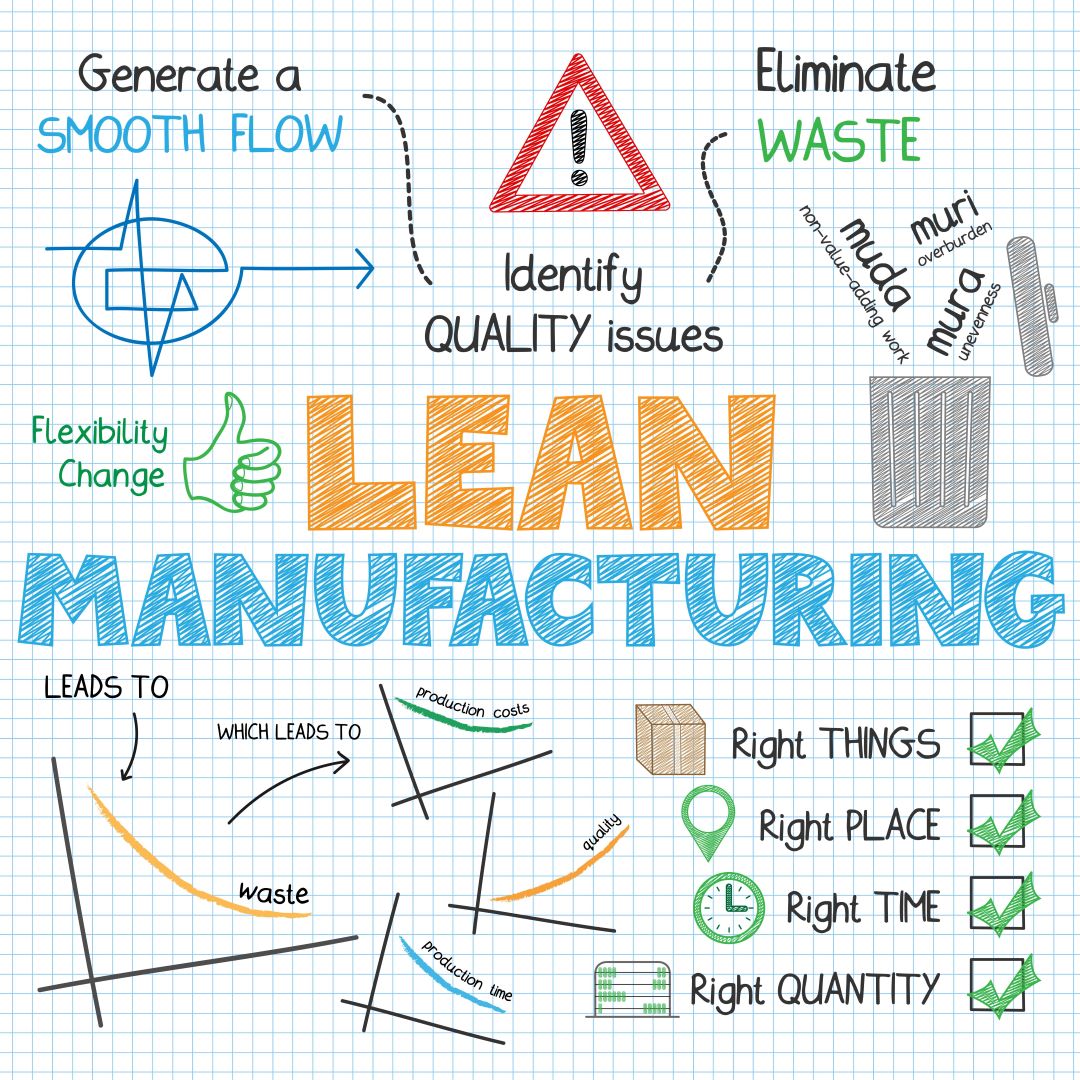
In today’s competitive manufacturing environment, Industry leaders search for even the smallest improvements to enhance overall production. One method which has been shown to sometimes significantly increase production across multiple manufacturing markets is the Overall Equipment Effectiveness method. Overall Equipment Effectiveness (OEE) is a key performance indicator which measures equipment’s level of productivity.
By understanding a piece of equipment’s level of productivity, the owner can reduce the number of defective products, optimize production processes, and even predict equipment maintenance needs.
The first step in grasping the OEE method is understanding the necessary calculations.
Calculate OEE
OEE is calculated utilizing three metrics:
- Availability: How often does the equipment function when required?
- Performance: How much does the equipment produce?
- Quality: How many defects does the equipment produce?
Each metric can be calculated using the equations listed below:
Availability is calculated by dividing the amount of time the equipment functions by the amount of time the equipment should function. A perfect piece of equipment will have a run time of 8-hours in an 8-hour production shift. Issues such as breakdowns and maintenance repairs will decrease the run time of the equipment as well as the availability.
Availability = Run Time / Production Time
Performance is calculated by multiplying the fastest possible time to manufacture one piece and the total number of pieces produced (including defective ones). This value is then divided by the amount of time the machine is spent running. The slower a machine produces items, the lower the performance.
Performance = (Ideal Cycle Time X Total Count) / Run Time
Quality is calculated by dividing the amount of non-defective pieces produced by the total amount of pieces produced.
Quality = Passing Count / Total Count
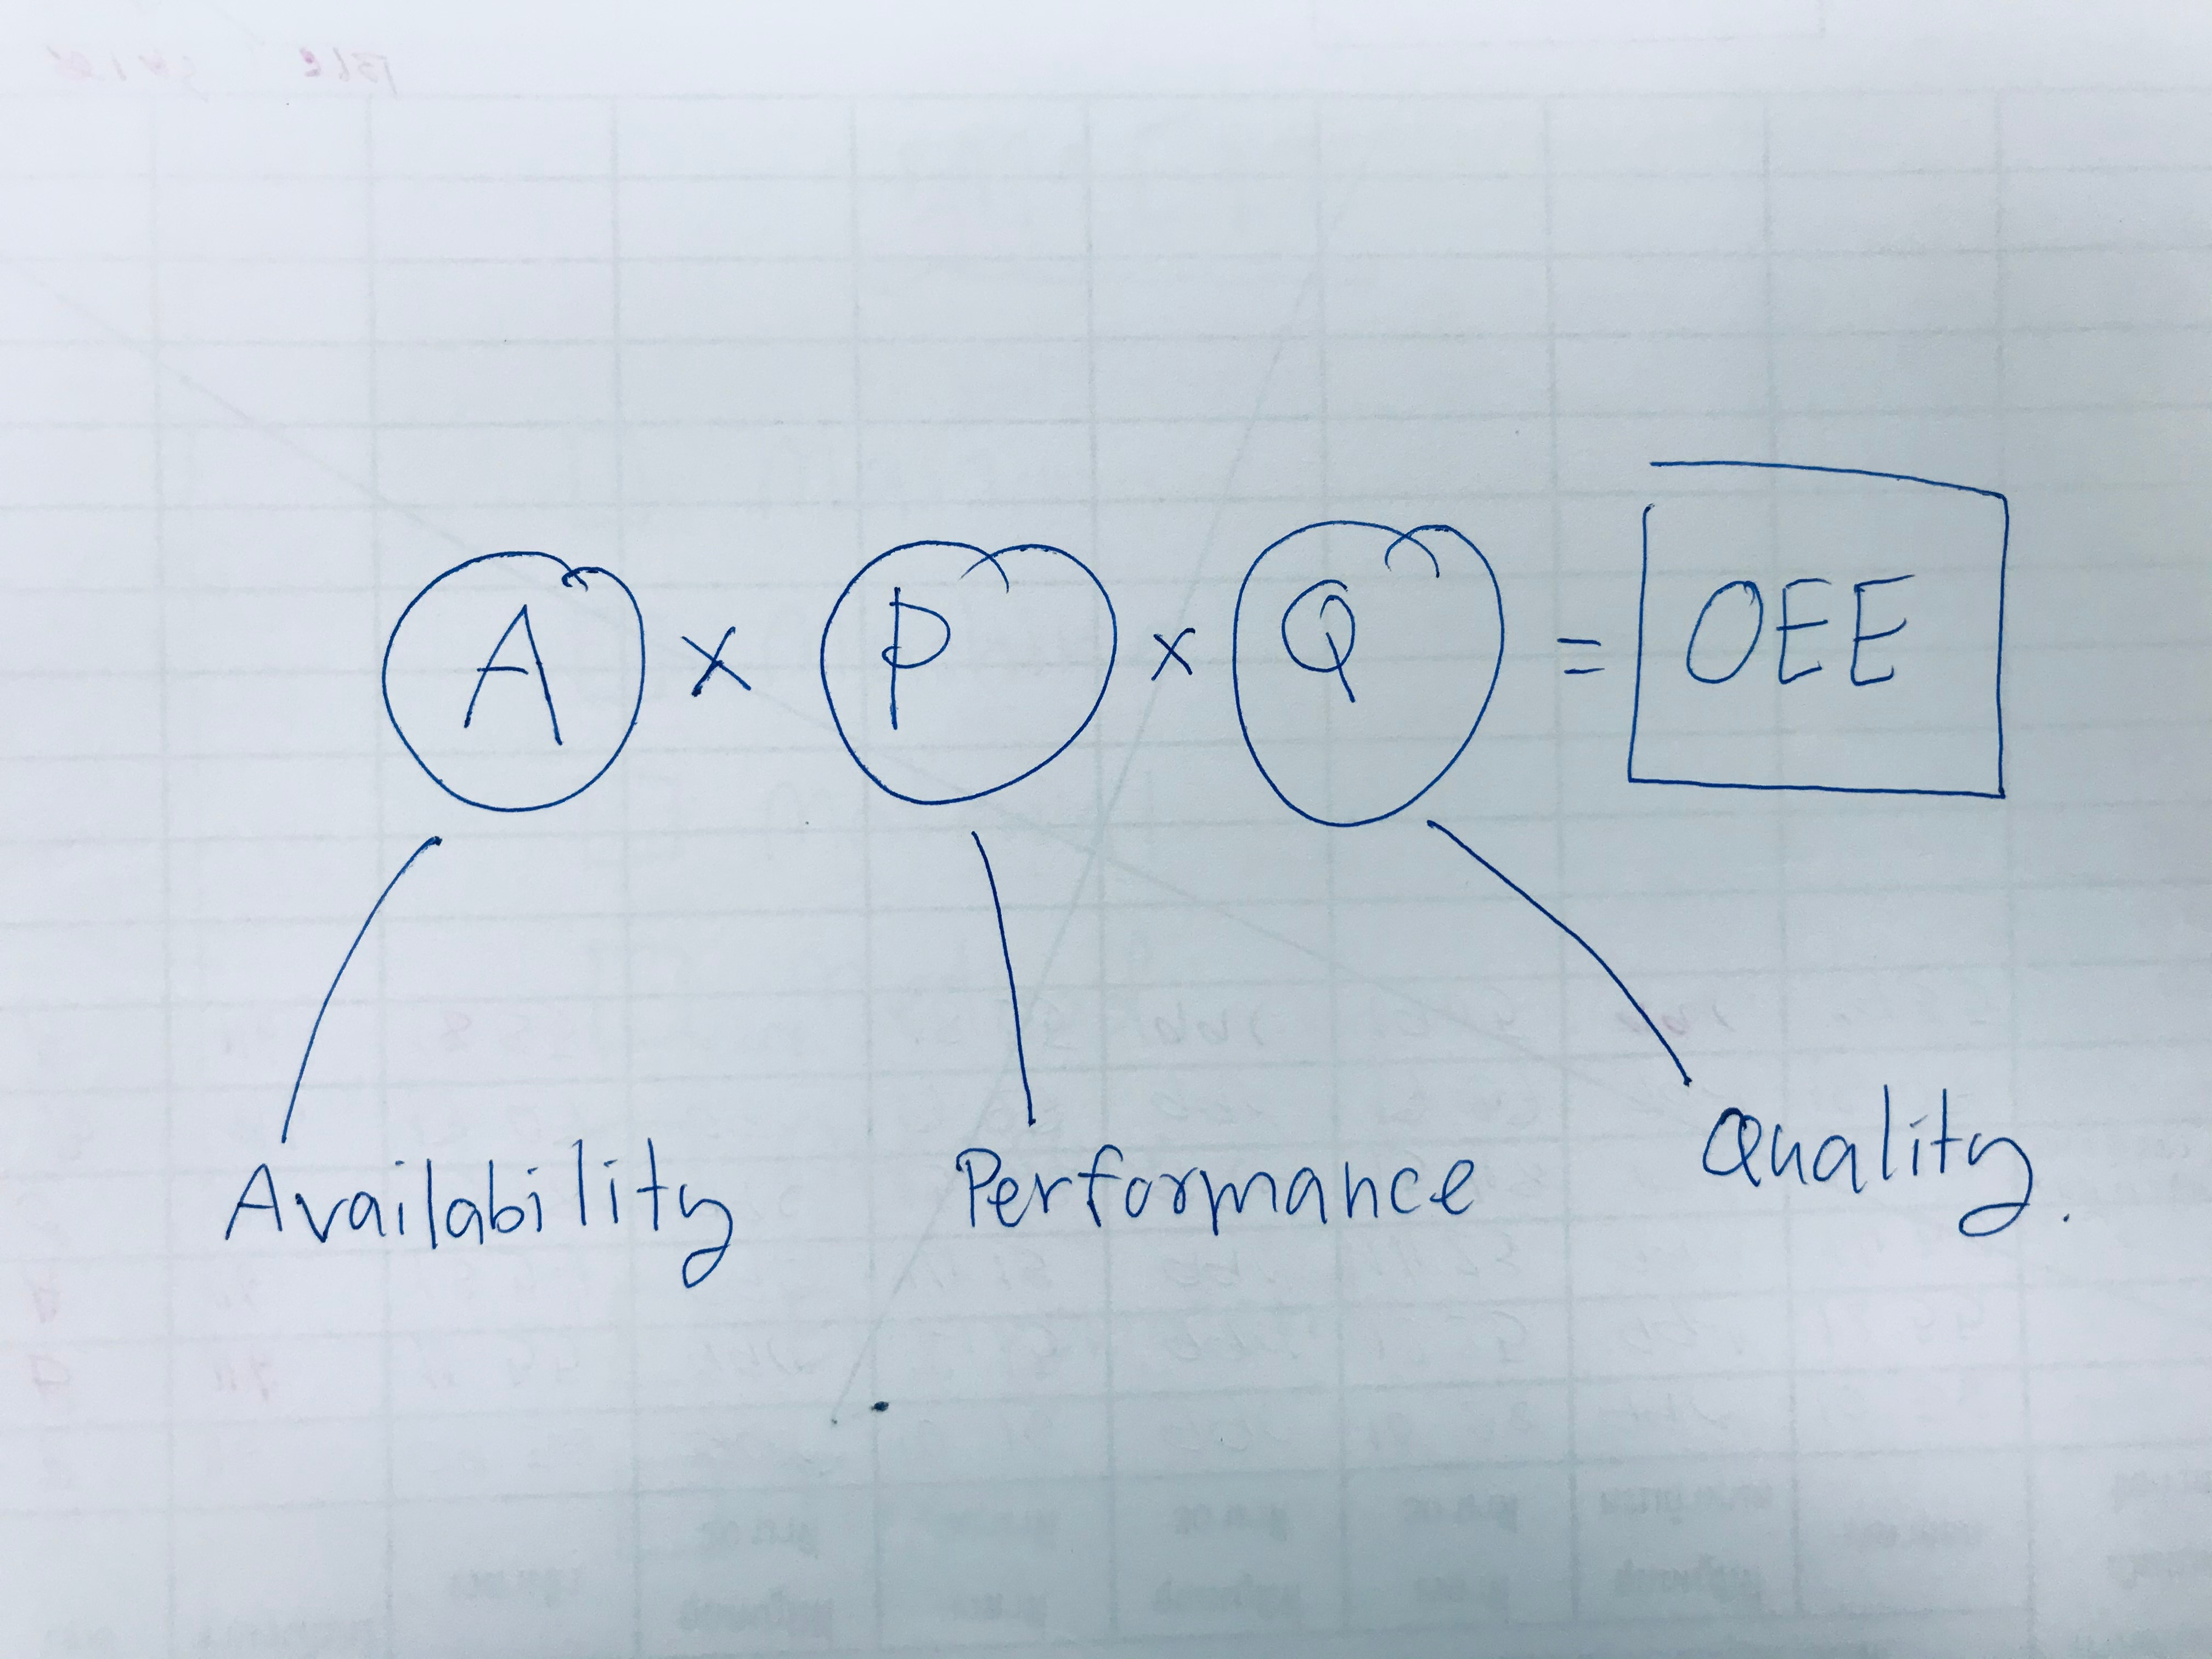
And finally, OEE is calculated by multiplying all three factors: availability, performance, and quality.
OEE = Availability X Performance X Quality
What does OEE tell you?
In an ideal world, equipment would receive 100% for all values. Unfortunately, this is not the case. Luckily, benchmarks have been developed so that owners may gauge the state of their equipment compared to industry standards.
Listed below is a breakdown of several benchmarks for the OEE method:
Ideal
Standard
Availability
90%
80%
Performance
95%
80%
Quality
99%
95%
OEE
85%
60%
Based off the benchmark table, you should be able to ascertain the performance level of your equipment.
By implementing Smart Factory technology, you can access machinery data in real time. This lets you build an OEE model for each key piece of machinery. A slide in OEE for a machine tells you that at least one factor, availability, performance and quality is deteriorating. This can be a signal that a machine is in need of maintenance before a significant breakdown occurs.
Overall, this method of predicting maintenance has the potential to save companies not only production time, but also a considerable amount of capital by maintaining high performance levels with minimum equipment unplanned outages.
Interested in gathering real time factory analytics data to empower your predictive maintenance program?