
What is Statistical Process Control?
Statistical Process Control (SPC) is a data driven process of collecting and analyzing key metrics to monitor and control the quality of a manufacturing process. SPC was pioneered in the 1920s and first introduced into the manufacturing industry during WW2.
Who used Statistical Process Control during WW2?
The Military became a leading user of SPC techniques during WW2, the need for quality and cost reductions within their facilities was at an all-time high, and perfecting the manufacturing process led to a more efficient way to produce munitions and firearms without compromising the safety of soldiers. SPC techniques faded after the war and migrated to Japan, but a comeback was inevitable. Due to pressure from the importation of high-quality Japanese products in the 1970s, the American industry re-adopted SPC where the system gained popularity and is today a commonly utilized quality monitoring tool in many different industries.
A deeper dive into Statistical Process Control
Statistical Process Control (SPC) is a proactive system that uses data to monitor the manufacturing process to prevent defects, moving away from the traditional post-production inspection, which is expensive, time-consuming, and doesn’t address production issues. When creating a new product, engineers will set parameters defined by the nominal value expected from the production process. As well, tolerances will be established to prevent defects, giveaway, and uphold quality standards. SPC can work within almost any manufacturing plant, below are a few examples.
Food and beverage example:
In a milk factory, production of 1-gallon milk jugs weighing 3,670 grams is the expectation. The nominal value will be 3,670 g with a tolerance of +/- 10 grams, the lower tolerance will be 3,660 g and the upper limit will be 3,680 g.
Automobile manufacturing example:
In an automobile plant, the production of engine pistons undergoes Statistical Process Control (SPC) to ensure quality. Engineers set parameters for dimensions like diameter, height, and weight. For instance, the nominal weight for a piston is 750 grams with tolerances of +/- 5 grams. This would leave our upper tolerance at 755 grams and our lower tolerance at 745 grams.
Pharmaceutical manufacturing example:
In tablet production, Statistical Process Control (SPC) ensures precise dosages. For example, tablets are set to weigh 200 milligrams, with tolerances of +/- 2 milligrams. Continuous monitoring detects deviations, enabling prompt corrective actions to maintain quality and safety, ensuring regulatory compliance and consumer trust.
What is an SPC Control Chart?
Perhaps the most powerful and widely used tool of SPC is the control chart, or "SPC Chart". Giving a visual representation of any production anomalies, the SPC Chart has been recreated in many versions and variations to best suit the needs of manufacturers. But generally speaking, there are two primary types of variation a SPC control chart tracks: common cause variation (CCV) and special cause variation (SCV). CCV is defined as the unavoidable variation that is a function of living in an imperfect world. If manufacturing remains between the Upper Control Limit (UCL) and Lower Control Limit (LCL), the plant is functioning correctly. Specification limits are also tracked, which corresponds to a capable process being able to fulfill a client’s needs. A SCV is a large variation that stems from an external factor affecting production and pushing the line outside the UCL and LCL.

Using SPC Control Charts to eliminate giveaway
The food industry is notorious for having high levels of giveaway (excess material or product given away unintentionally, with the already low-profit margins an excess of product in packaging reduces profit margins. For example, giving away 11 grams of milk per gallon isn’t a problem when you sell 10 gallons per week but when you are selling thousands of gallons a month, it cuts into your profits. Managing giveaway is easy when you have the correct production monitoring system in place and can view a control chart. Let's take a look at this example.
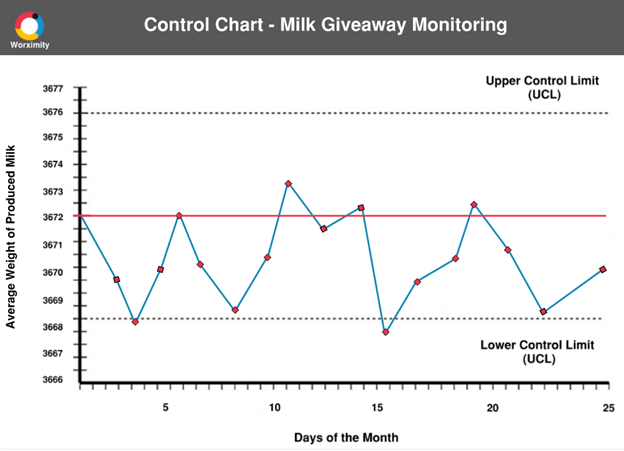
Above is a graph showing the average weight of milk over a month. Unfortunately, this production facility entered their Lower Control Limit, but SPC data caught the underweight products and alerted management and shop floor personnel, and actions were taken to increase milk weight over the next couple of days.
Giveaway monitoring with Worximity
Worximity offers assistance in monitoring both sampling and in-line checkweighers. With respective KPIs provided, Worximity’s technology enables the digitization of giveaway monitoring via connectivity to tabletop scales or in-line checkweighers. These measuring devices relay product weight averages and individual weights, allowing for the actual giveaway and target giveaway to be compared leaving us with current giveaway quantities as well as percentages. By measuring giveaway in real time, manufacturers have faster and better control over production.
Limit your losses
Statistical Process Control (SPC) is essential in modern manufacturing, using data analytics for consistent quality and efficiency. SPC control charts provide visual insights into production anomalies, enabling timely actions. They also manage giveaway, critical in almost every industry, where excess material affects profit margins. Leveraging technology such as Worximity facilitates precise giveaway monitoring, optimizing operational efficiency. SPC is indispensable, empowering businesses to deliver superior quality while maximizing profitability and customer satisfaction. Learn more about how Worximity tracks giveaway here.