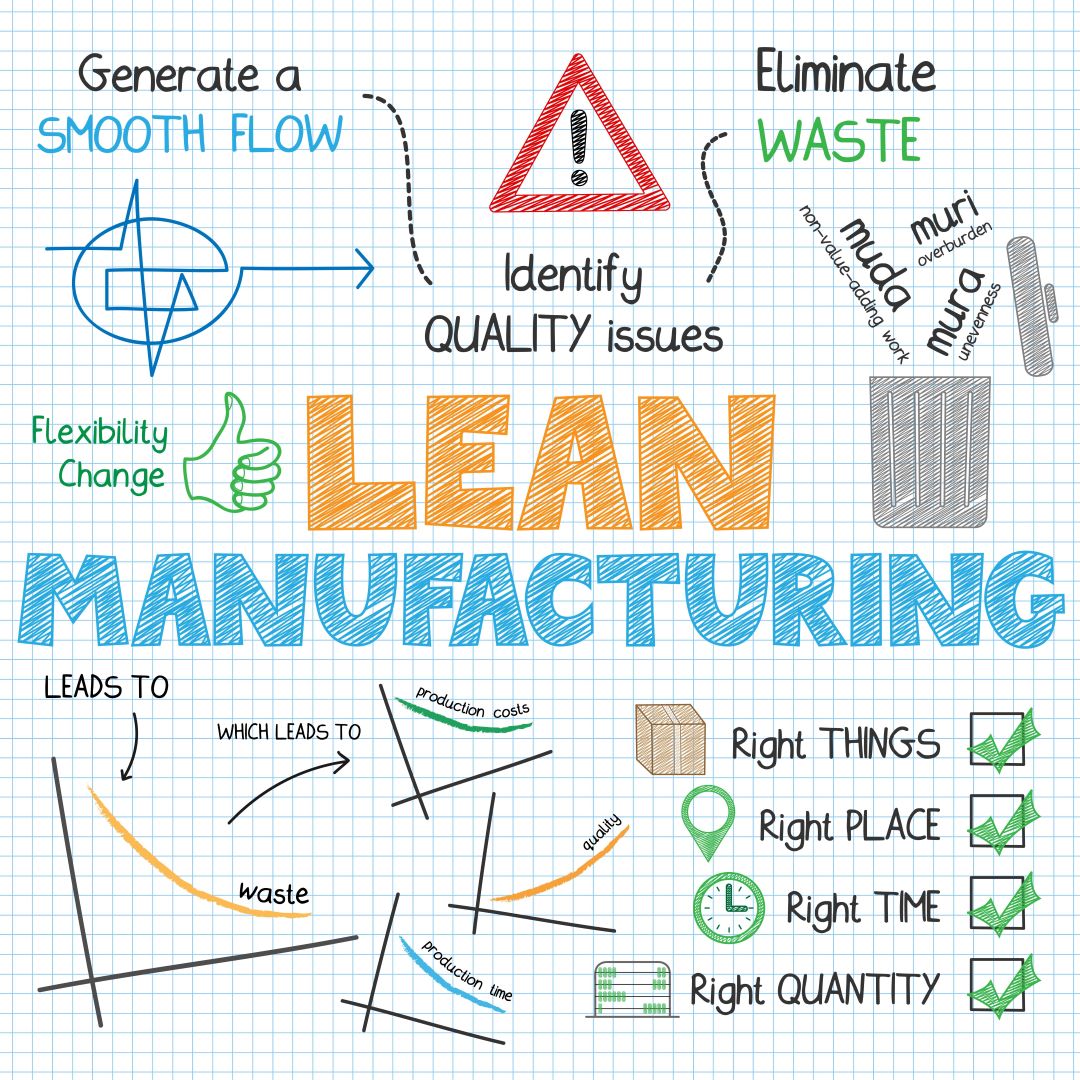
Overall equipment effectiveness (OEE) is an all-encompassing metric in the manufacturing industry meant to represent the efficiency of a manufacturing operation, from an individual machine to an entire factory. Knowing the ways to calculate OEE for a particular industry can be important, and it’s particularly valuable to know your OEE in the manufacturing industry. The OEE formula is relatively straightforward and remains a constant; however, getting at key data for calculating OEE for your industry can be a bit confusing.
The Importance of OEE in the Food and Beverage Manufacturing Industry
Although it is a valuable and insightful metric in any industry, it is particularly valuable to be able to monitor key OEE inputs and generate a calculated value in the food and beverage manufacturing industry. Approximately 75 percent of food manufacturers measure OEE, whereas only 50 percent of companies in other industries, such as pharmaceutical manufacturing, calculate OEE.
The food and beverage manufacturing industry operates on thin profit margins, forcing manufacturers to maximize their manufacturing efficiency and optimize their product yield as much as possible. Because a calculated OEE represents both of these factors, it is important to monitor OEE in the manufacturing industry. However, OEE is a perfect measure for food manufacturers to use to monitor the health of their manufacturing operations.
Calculating OEE in the Manufacturing Industry
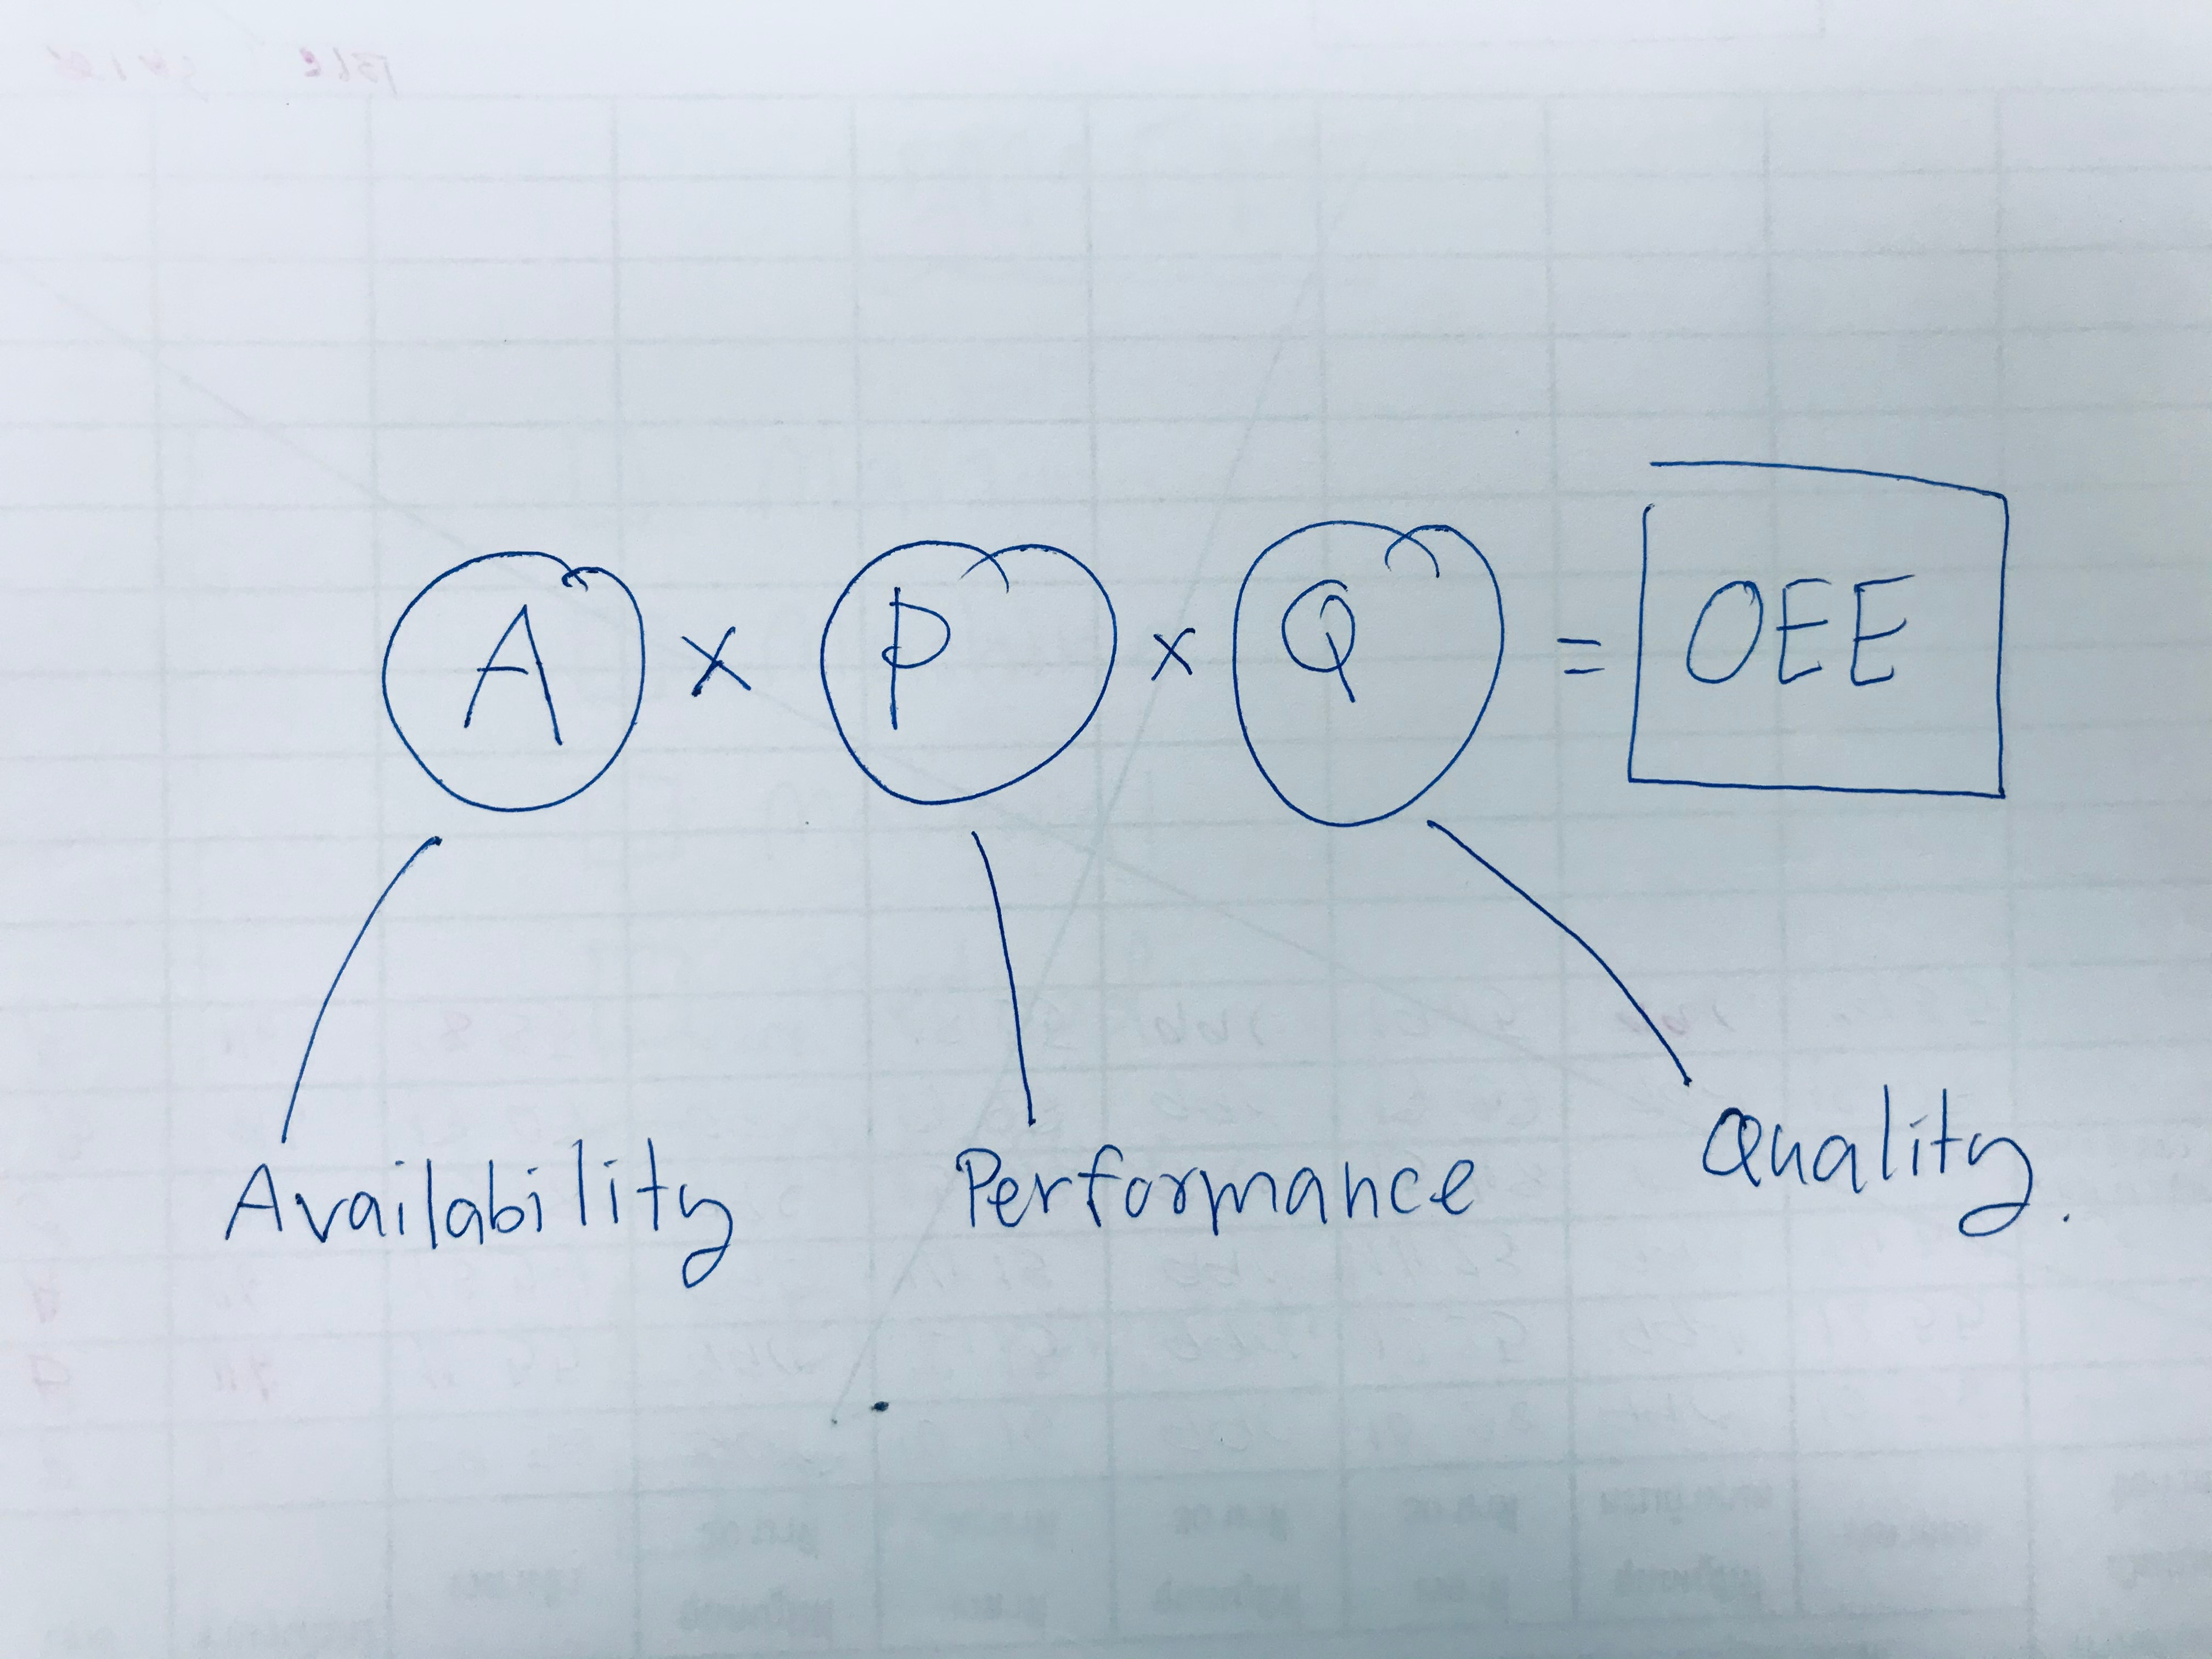
OEE is expressed as a percentage that results from the multiplication of three factors: machinery availability, production performance, and product quality.
OEE = Availability x Performance x Quality
Availability = Runtime / Planned Production Time
Performance = Ideal Cycle Time / Actual Average Cycle Time
Quality = Good Products / Total Products Produced
What makes OEE so powerful as a manufacturing metric is that it measures improvements or declines across reliability, performance, and quality, giving a valuable aggregate insight into the most important manufacturing goals.
In the food and beverage manufacturing industry, OEE is calculated much like it is calculated in other industries, using the model above. However, the food and beverage industry differs from other industries in its areas of focus for improving OEE.
When calculating OEE in the food and beverage manufacturing industry, it’s important to recognize that processing food is very different from manufacturing or processing any other type of product.
Unique Factors That Affect OEE in the Food and Beverage Manufacturing Industry
Food ingredients can be highly variable in their physical attributes because of where the raw materials come from. Product attributes such as weight, shape, density, moisture content, stickiness, and viscosity can all vary considerably from one batch to the next. This means that machinery and processes that are designed around an expected set of physical properties can struggle to operate or produce quality end products when the physical properties of the products they’re processing vary.
Food can be perishable, so downtimes that might create only the operational costs of lost production in other industries can create additional costs in the form of product waste in the food and beverage industry. The impact of food and beverages sitting exposed to the wrong temperature, too much humidity, or other environmental conditions can quickly diminish product quality and create waste.
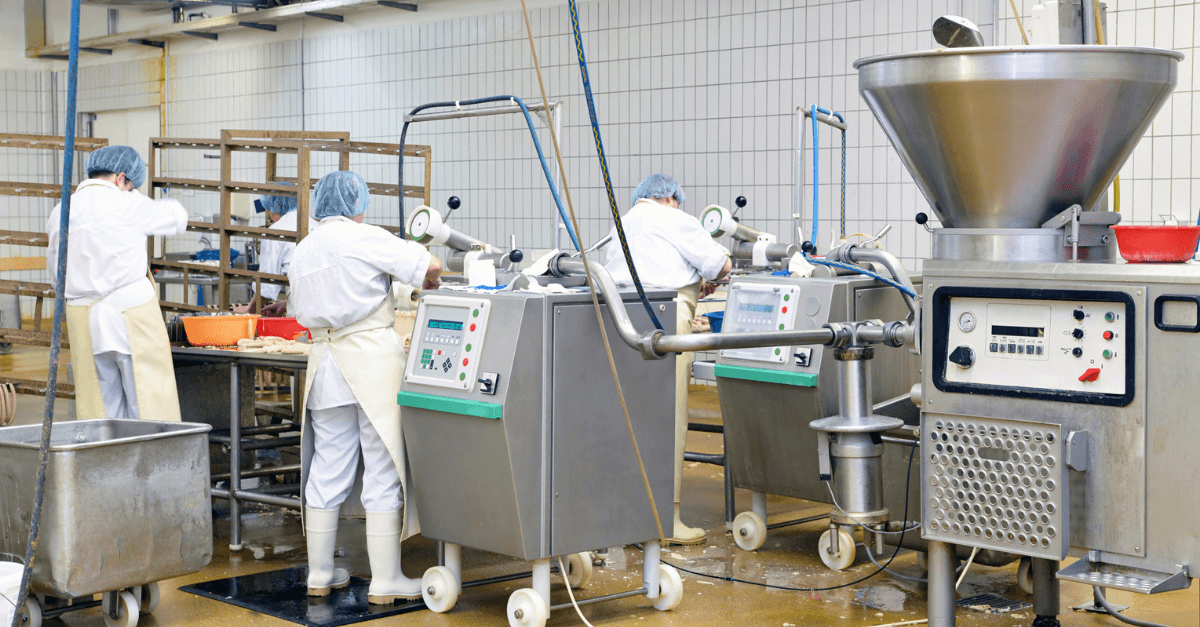
Food processing machinery such as baggers and other types of filling machines as well as other food processing machinery like labellers are notoriously susceptible to processing variations and jamming, requiring near-constant monitoring and adjustment or clearing of jams and restarting.
Maximizing Value in the Food and Beverage Industry with OEE
When looking to optimize OEE, food and beverage manufacturers tend to focus more narrowly on availability and quality as factors that will produce the most business impact. Because much of food and beverage manufacturing today uses automated machinery, the factors that contribute to performance tend to lead to lesser gains in calculated OEE for food manufacturers.
Optimizing Availability
As a result of the types of machinery being operated and the potential for losses not only from lost production but also from wastage, calculating machinery, line, and facility downtime tends to be a primary focus for food manufacturing businesses. These forms of downtime are primary contributors to availability. Even if a facility or company is not calculating its OEE, there is often an intuitive sense that calculating and minimizing downtime is essential to driving profitability.
Calculating a machine or line’s downtime and reducing it so as to improve availability can be tricky. In many facilities, micro-stoppages occur when a machine or line is down for a very short period of time, perhaps while a jammed bag is cleared or a labeller is refilled. An employee working a line may not think that a very short outage is a big deal, because it’s so short, but over a long period of time, these micro-stoppages can accumulate into significant amounts of downtime and loss machine or line availability.
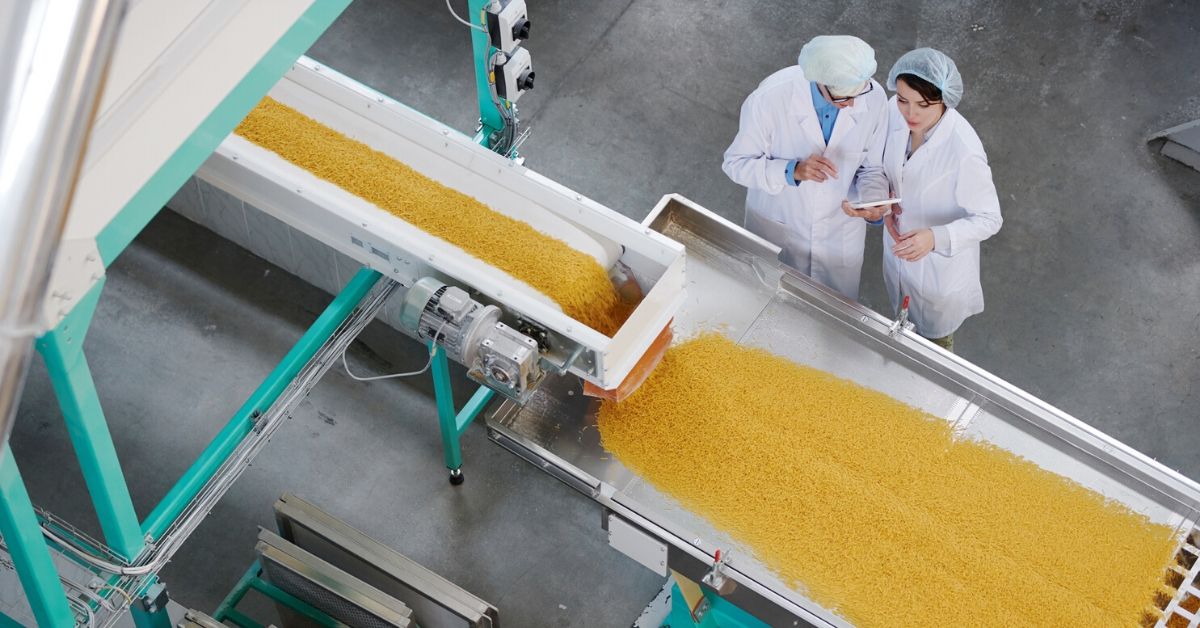
Optimizing Quality
The second area that food manufacturers focus on when calculating their OEE is quality. As mentioned above, food manufacturing processes can be difficult to optimize for quality because the ingredients can be highly variable.
This difficulty is compounded by the trend of manufacturing smaller lot sizes of more varied or customized products to meet consumers’ changing needs. Consumers now expect a wide variety of product variations, including for specific types of diets, for packaging size, or for convenience. Constantly changing lines to map to a varied production schedule can lead to product quality issues on startup while a process is re-dialed in for another product or if the line is not correctly set up for the new product being run.
Measuring rejects and understanding where and when issues occur can be a critical component of driving improved OEE as well as discovering opportunities for rejects valorization.
Challenges of Measuring OEE in the Food and Beverage Industry
Employees or managers often have a disincentive to accurately report downtimes because they may feel that it reflects poorly on their performance. Paper-based systems or systems that rely on a person to record downtimes and causes can be error-prone and can produce different reports during different shifts as different people are using non-standard metrics and causes in their reports.
That’s why measuring downtime and calculating OEE for the food and beverage industry can be a real challenge. Because downtime is a core cause of low OEE in food manufacturing, getting access to accurate downtime data and causes can be an effective way to get the most improvement in OEE in the shortest amount of time. Using technology that is simple and cost-effective to install and get running, such as Worximity, can produce quick OEE gains and significantly improved profitability, even by only focusing on measuring downtime and getting at root causes.
What to Look for First When Calculating the OEE of a Food Manufacturing Facility
To determine where to first focus your efforts, an assessment of your level of automation may guide you to focusing on measuring performance factors first.
As noted above, food manufacturers tend to focus less on measuring performance when calculating their OEE, because a high degree of automation leads to cycle times that are often quite consistent. It is still important to optimize cycle efficiency so that every step of manufacturing is completed as quickly as possible, however. Of course, performance becomes more important to monitor in facilities in which one or several steps of the manufacturing process is conducted manually, meaning that the facility must optimize this process for the employees so that it can be completed as quickly and efficiently as possible.
To understand where you stand with your OEE, why not download our Free OEE Calculator?